
New format for alt-3 league tables
Today’s alt-3 Premier League table is the first one to be presented in a re-designed format.
The table itself (i.e., the ordering of teams) is unchanged, as is the underlying method.
The re-design affects only the way in which the table is presented — specifically the rightmost two columns, which are the essence of the alt-3 table. The ‘old’ format showed an additive schedule-strength adjustment to every team’s current league points total. That is now replaced by a presentation that copes better with (especially) ‘games in hand’, i.e., those frequent times in the season when not all teams have played the same number of matches.
The new presentation also eliminates any hint of prediction in relation to the alt-3 method — which is important, as the alt-3 league table is definitely not a prediction, merely a faithful representation of where teams currently stand.
The new alt-3 table format uses the same (mathematically principled and internally consistent) schedule-strength calculation as always, but now represents it in a more streamlined way through each team’s effective number of matches played — the new ePld column in the table.
A snapshot of today’s alt-3 Premier League table illustrates how this works:
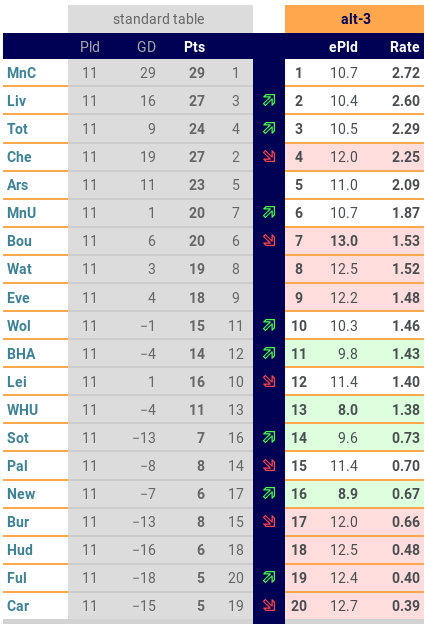
Every team has played 11 league matches. But the effective number of matches played varies. A team that has played an exceptionally tough set of fixtures so far this season has seen less real opportunity to accumulate league points, and so has a value of ePld that is smaller than 11. Likewise, a team whose fixtures have been easier than average has a larger ePld (larger than the 11 matches actually played).
In the current Premier League table, the most extreme example is West Ham United (as I wrote about previously). The Hammers faced an exceptionally tough run of fixtures in their first 10 matches of this season: see their current schedule-strength chart for the detail. Their current schedule-strength rating is +3.0; and this makes their current ePld equal to 11 − 3.0 = 8.0. The way to think about this in terms of effective number of matches played is that West Ham have effectively three games in hand at this point in time.
Once the current values of ePld have been calculated, the alt-3 table is formed simply by ranking the teams according to their league points per effective match played, i.e.,
Unfortunately for West Ham this does not quite do enough to lift them from 13th position in the table, since their nearest neighbours (in terms of league points total) are Brighton and Hove Albion, who also have faced a tougher than average start to the season (Brighton’s current schedule strength is +1.2).
It is perhaps worth reiterating, that the alt-3 ranking methodology (and hence the ranking of the alt-3 table itself) is completely unchanged from before. All that has changed, with today’s re-design, is the way of presenting things.
I (of course) think it’s a definite improvement. I hope others will agree!
To see any club’s schedule-strength chart, just click on the club name in the alt-3 league table.